

Introduction
GLIMPS is a free software package for remote sensing and imaging spectroscopy and muiltispectral remote sensing data viewing and image analysis. GLIMPS is part of the ReSe Software family and is included as part of the professional packages PARGE®, DROACOR®, ATCOR®, and MODO.
Image Analysis Features
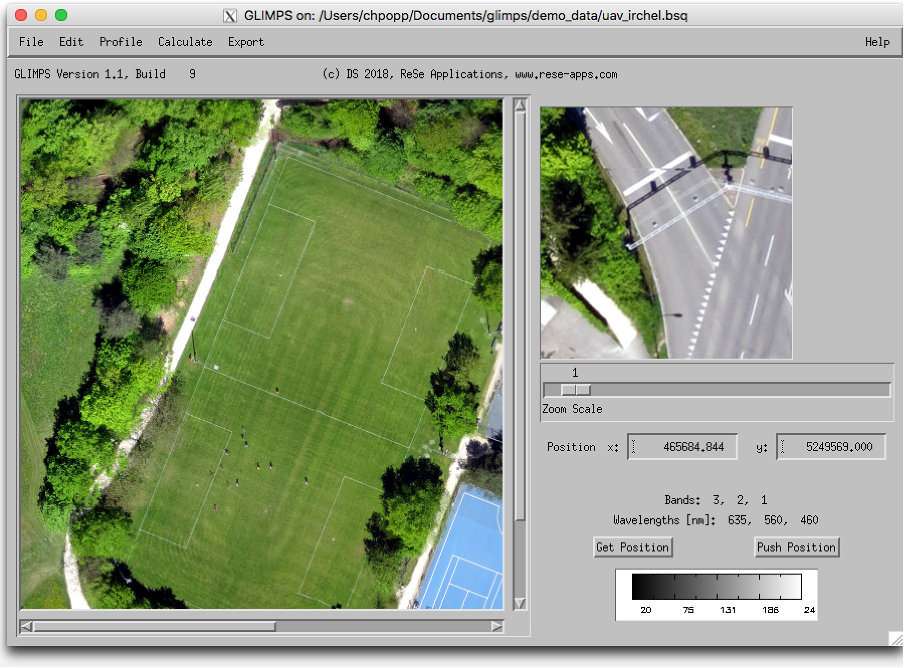
- ENVI™ File display including various scaling options
- multispectral/hyperspectral image analysis
- native multiband TIFF and JPG support
- export of scaled image to GIF/JPG/TIFF/PNG
- image profiles (x,y) and spectral profile (Z profile)
- spectrum collection
- export of spectral profiles to spectral libraries
- coordinate linking support
- cube rectification to arbitrary resolution, extent, and rotation
- pseudo colour display of single band imagery and indices
- scale to exact range of single band imagery
- spectral band index calculation (Various Vegetation Indices, Absorption Depth)
- spectral classification (image based/SLB based) using spectral angle or spectral fit
- spectral library display (ENVI™ file format)
- statistics calculation to spectral library
- text file display
Below, a short description of the individual functions
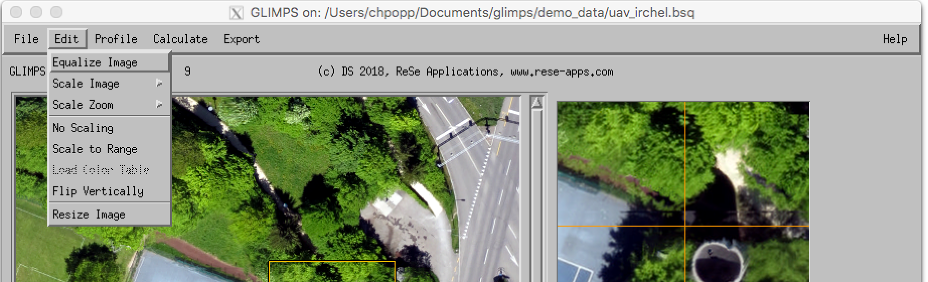
Equalize Image: Performs a histogram equalization on all bands that have been selected by the band se- lection tool and scales the whole image accordingly.
Scale Image: Applies standard linear scaling on the imagery using the following differing methods: Mean- 1, Mean-2, Mean-3, Lin 1%, Lin 2%, Lin 4%, and RGB 2%.
Scale Zoom: Applies the standard linear scaling on the imagery using the above-described six differing methods, but using the statistics of the currently displayed zoom window.
No Scaling: Reverts to an unscaled display of the image.
Scale to Range: Scales a single-band image linearly to a range entered as lower and upper limit as two comma-separated values.
Load Color Table: This option is applicable for single band display only, e.g. to display index values.
Flip Vertically: Flips the image display vertically, e.g. which is suitable for unrectified images which may appear mirrored depending on data acquisition.
Resize Image: This tool allows to resize the currently displayed image to new spatial dimensions, option- ally based on a reference image.
Profile Options
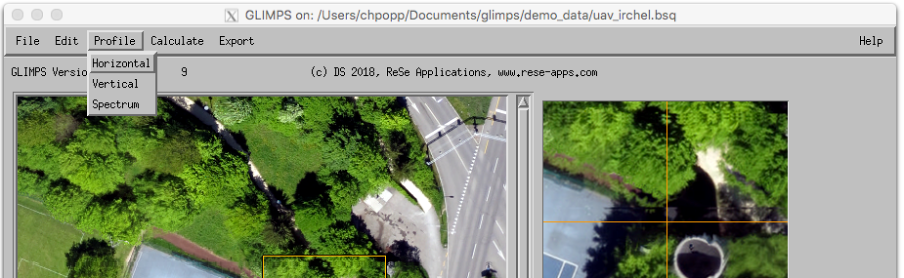
Horizontal: Opens a window for a horizontal profile through the whole image of the currently displayed bands; for RGB images, three profiles are shown in the respective colors
Vertical: Opens a window for a vertical profile through the image (of the first band only).
Spectrum: Opens a window for a spectrum of the image (for images with 4 and more bands only); click on an image location to show the spectrum directly. For multispectral data, the band positions are shown as red squares.
Profile Window Options: There are different functions available within these plot windows.
Spectrum Window: This allows the set the averaging window for spectrum display. The given number are the number of pixels of a square sample taken at the pixel location
Installation
First time users are asked to register in order to get access to the download area. After registration, a ReSe Software directory is downloaded to your computer.
Contact us
Thanks for your interest in our software products. Just let us know if you require any further information. We would be happy to help you in your remote sensing needs.

