

Data Processing
Calculate:
The menu ’Calculate’ offers various options for image processing and statistical analysis, such as radiometric correction, the calculation of band indices, or spectral classification.
Options for image processing and statistical analysis
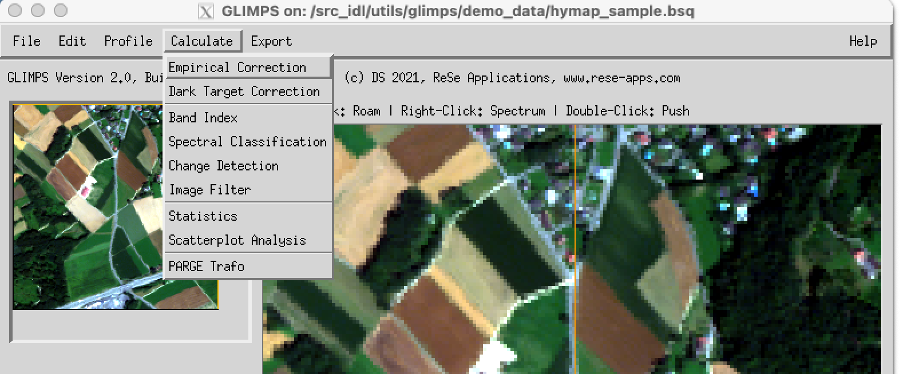
Empirical Correction: This function is to perform an empirical radiometric correction of any imagery based on reference spectra. It is based on a simple empirical radiometric correction approach where all pixels in an image are adjusted to a bright and/or dark reference, arbitrarily found in the image itself or from ground measurements.
Dark Target Correction This routine performs a dark target signature correction by searching for the darkest pixels in the red image of the cube and using the respective spectra for correction of the whole image.
Band Index: This option allows to calculate a spectral band index from the currently displayed multi/hyperspectral imagery such as band ratio or NDVI-type of indices. The resulting image is stored in a separate file.
Spectral Classification: This option allows to calculate a spectral quantification/classification using the spectral angle mapper or a spectral fitting technique in combination with endmember spectra which may either be image-based or from external sources.
Change Detection: This function searches for differences between two images and displays the corresponding statistics. For now, only single bands are compared.
Statistics: This procedure calculates the statistics per spectral band from the current image and stores the result as a SLB file with the spectra: Minimum,5% Percentile,Median,95% Per- centile, Maximum, Mean, and Standard Deviation of the whole image.
Image Filter: This allows to apply standard spatial filters to imagery. Outputs will be filtered band-by band with the respective filter size and selected function.
Scatterplot Analysis: Want to know if data outputs are correlated against each other? This function helps to understand spatial correlations between images of the same spatial dimensions. Two images are read and plotted against each other and a statistical analysis is performed after applying a polynomial fit based on Chi-Square optimization.
PARGE®: This tool is an interface for image rectification of PARGE® outputs. It is useful for data end users who receive their airborne scanner data from providers in unrectified format but with all relevant information from PARGE® processing (i.e. the parge processing status .gcs and the image geometry map _igm.bsq). Some of its functions may also be used without access to PARGE® outputs.
Export:
Export allows to export the currently displayed image of either the zoom or the full image window to one of the given image data formats. The displayed image may be exported as a scaled 8bit/24bit image to the available standard image formats.
Below, a description of the individual functions
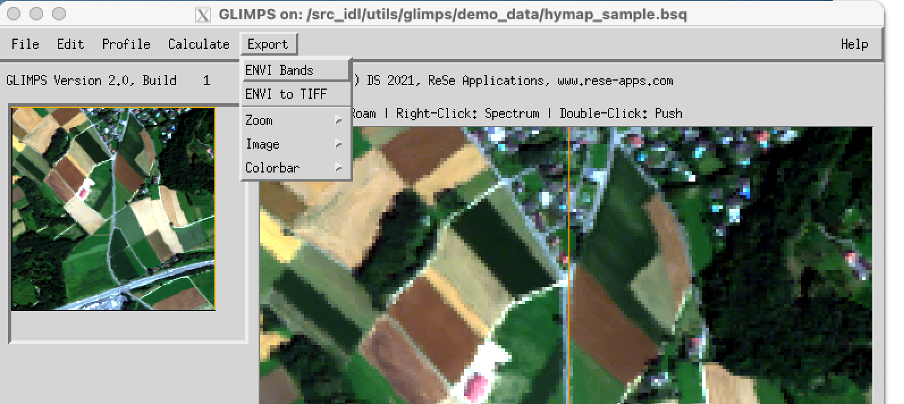
ENVI™ Bands: Exports the currently displayed image (e.g. a RGB based on three spectral bands or a single band) to a new BSQ file.
ENVI™ to TIFF: Converts a selected ENVI BSQ file to a multi-channel TIFT file; the output TIFF will contain all spectral data. An TIFF world file (.tfw) is written containing the geometric information.
Zoom: Exports the currently displayed content of the zoom window. One of the following file formats can be chosen: GIF, PICT, PNG, TIFF, JPEG.
Image: Exports the currently displayed content of the image window. One of the following file formats can be chosen: GIF, PICT, PNG, TIFF, JPEG.
Colorbar: Exports the currently displayed colorbar. One of the following file formats can be chosen: EPS, GIF, or JPEG.
Tutorial Exercises
Some tutorial exercises are available in the software distribution. These exercises shall help to better understand multispectral and hyperspectral re- mote sensing data on the basis of the GLIMPS software functions. Sample data sets are included or are provided upon request.

